
A small field story, a big number, and a clear question
I started one dusty morning in West Texas, boots on gravel, listening to a 200 MW wind farm hum. Utility scale battery storage sat in gray containers behind the substation, quiet as sleeping trucks (but they never sleep). In 2023, the site curtailed over 40 GWh because the batteries couldn’t take it fast enough, and I kept asking myself: are we buying the right boxes from the right utility scale battery storage manufacturers? I’ve spent over 17 years buying, commissioning, and troubleshooting big storage—from a 100 MW/200 MWh build outside Bakersfield in 2021 to a 50 MW augmentation sprint in ERCOT last summer—and I still see the same pattern. We fix one bottleneck, another pops up. The simple question: how do we compare makers so the money we spend actually shows up in real MWh and real uptime?
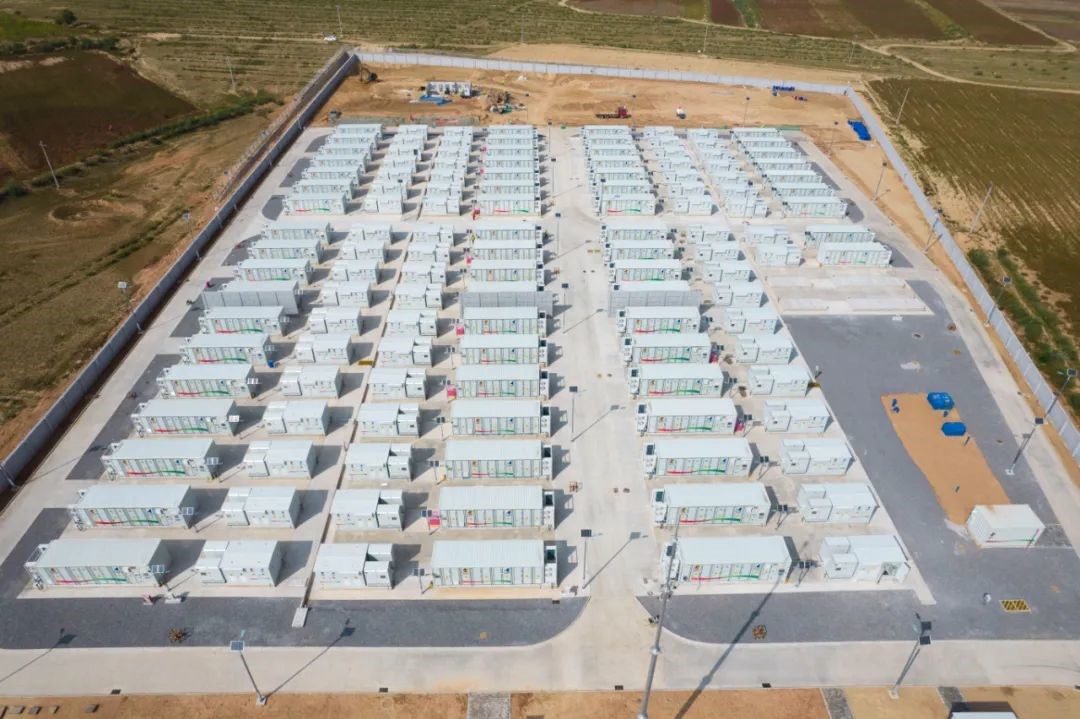
I’ll keep the words light and clean—because power is serious, but the decision path does not have to be. We’ll move from a field problem to what matters on your shortlist, then to where the tech is heading. Ready to walk the yard with me?
Where the usual buying playbook goes sideways
What’s the hidden snag?
When I audit purchase decisions, I see a familiar trap. Spec sheets promise 95% round-trip efficiency and 20-year life, but the yard tells a different story once auxiliary load and thermal margins bite. On that Bakersfield job in June 2021, the HVAC on three blocks drew a steady 1.1 MW during an August heat wave—more than the datasheet’s “typical” 0.6 MW. That erased roughly 2.6% of expected net output over the month. The pain isn’t the number alone; it’s that most contracts never adjust warranty triggers for climate and duty cycle. We assume equal performance, but dispatch profiles, ambient bands, and even door-open hours push different results, and only a few makers instrument parasitics down to fan frequency and heater duty. I firmly prefer vendors who expose granular auxiliary telemetry and tie it to liquid-cooling setpoints in their BMS firmware, because that’s where efficiency really lives.
Two more things burn projects. First, power converters and PCS integration get treated like a bolt-on when they’re the heart of grid compliance. In 2022, I watched an interconnect test in Clark County stall two days because the PCS firmware missed a reactive power ramp requirement by 0.7 seconds—tiny in theory, costly in cranes and crews. Second, safety testing is waved off as “standard,” but UL 9540A variance, smoke indexing, and AHJ interpretations shift by county. I’ve stood next to a fire marshal who wants cell-level propagation data at 45% state of charge, not 50%. If a maker can’t show cell-to-container propagation results and clear exhaust duct calculations, you inherit the delay. I know that sounds blunt; I want it blunt. Let’s keep this plain and doable for the folks signing checks and standing in the dust.
Looking forward: principles that separate signal from noise
What’s Next
I measure makers by a few forward-leaning principles that go beyond pretty brochures. First, grid-forming readiness matters even if your utility isn’t asking for it yet. In March 2024, a 25 MW block I helped commission north of Abilene ran a black start trial through the PCS with a virtual synchronous mode. It needed tighter harmonics than the default config, but once tuned, the inverters held 49.8–50.2 Hz with a 12% step load. That stability didn’t show up in the sales demo—only in the site logs. Second, cell chemistry transparency and augmentation roadmaps make or break Year 7. If we don’t know whether the vendor will hold LFP cell format and tab design for replacements, we can blow our DC bus layout and spend weeks refitting trays. Third, edge computing nodes in the BMS should run local analytics: degradation flags tied to calendar vs. cycle stress, not a black-box score. The best utility scale battery storage manufacturers will show you scatter plots of SOH drift vs. ambient deltas at the string level—dry, yes, but the trail of evidence saves money later.
Now, compare this with cases that sound similar on paper but diverge in practice. In early 2022, two 50 MW sites in the same ISO chose different container platforms—both LFP, both rated for 2C. The site with liquid cooling tied to ambient forecasting and a predictive fan curve kept modules within a 3°C delta. The air-cooled design floated to 8–10°C delta under the same dispatch. Over 14 months, the tighter delta produced a 0.9% better round-trip efficiency and 0.6% less capacity fade at 80% DoD. Not theory—meter reads and capacity tests. If a vendor can’t provide a documented fan curve strategy and a failure mode effects analysis for their thermal loop, I walk. And yes, I’ve walked mid-negotiation—because a glossy P99 means nothing when the auxiliary load creeps at night and you don’t know why.
Let me leave you with a short, practical filter I use when shortlisting utility scale battery storage manufacturers. One: ask for net MWh forecasts that subtract auxiliary load by hour for your climate file, and make them bind this in the contract baseline. Two: demand PCS event logs from a passed grid compliance test—voltage ride-through, frequency ride-through, and reactive ramp—plus the commissioning time stamps; if they hesitate, I downgrade. Three: verify UL 9540A test reports at the cell, module, and unit levels that match the exact configuration you will receive, not “equivalents.” I’ve made these asks in Austin, Fresno, and Sparks, and the vendors who smile and open the folder are usually the ones whose sites look calm at 2 a.m.—which is when the truth shows. If you need a quiet, well-instrumented yard and a partner who respects field data over slogans, that’s the path I trust, and I don’t say that lightly. For reference without the hard sell, see HiTHIUM.